
Coin Observatory Algos
Indicators Built By Today's Technicians For Tomorrow's Markets
Indicator Suite
The Ultimate TradingView Indicator Suite To Start Trading Like A Professional
Discover HowProfessionals Read The Market
Are you struggling to make smart entries and winning trades?
Does the market often go against you after entering your position?
We Get It!
And we're here to help you change that. There's a LOT of trading advice out there...and to be honest, most of it isn't so great.
With our scripts, you will...
- Have a unique edge
- See clear Potential Reversal Zones
- Use leading data, not lagging
- Have simple signals
- Access a #1-ranked trader community
What You Get
Here's what you get with the Script Suite Bundle:
- Phantom Script
- XABCD Scanner
- NEW Relative Breadth Index
- #1 Ranked Trading Community

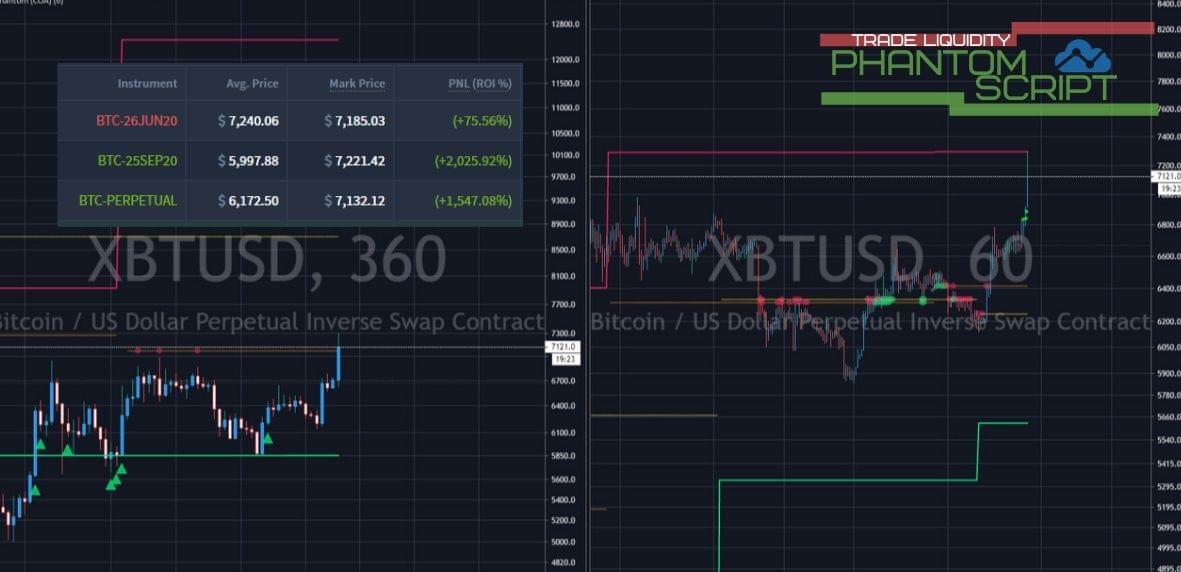
Phantom Script

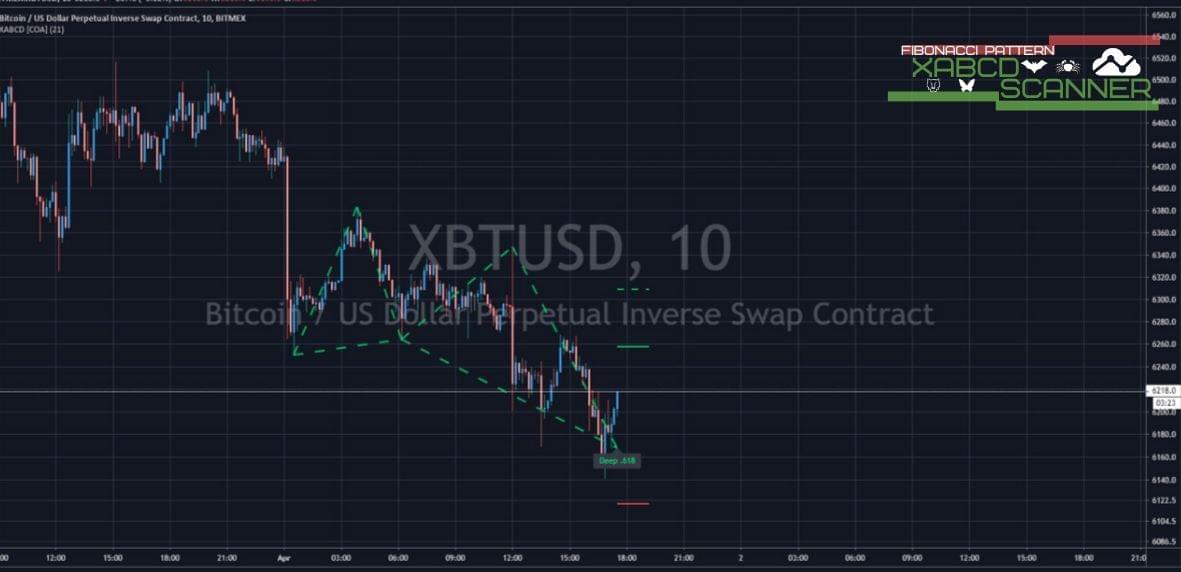
XABCD Scanner

NEW Relative Breadth Index
Original Price: $229 per month
Current Price: $129.99
Current Price: $129.99
CUSTOM JAVASCRIPT / HTML
What Others Have Said:

1. Phantom Script
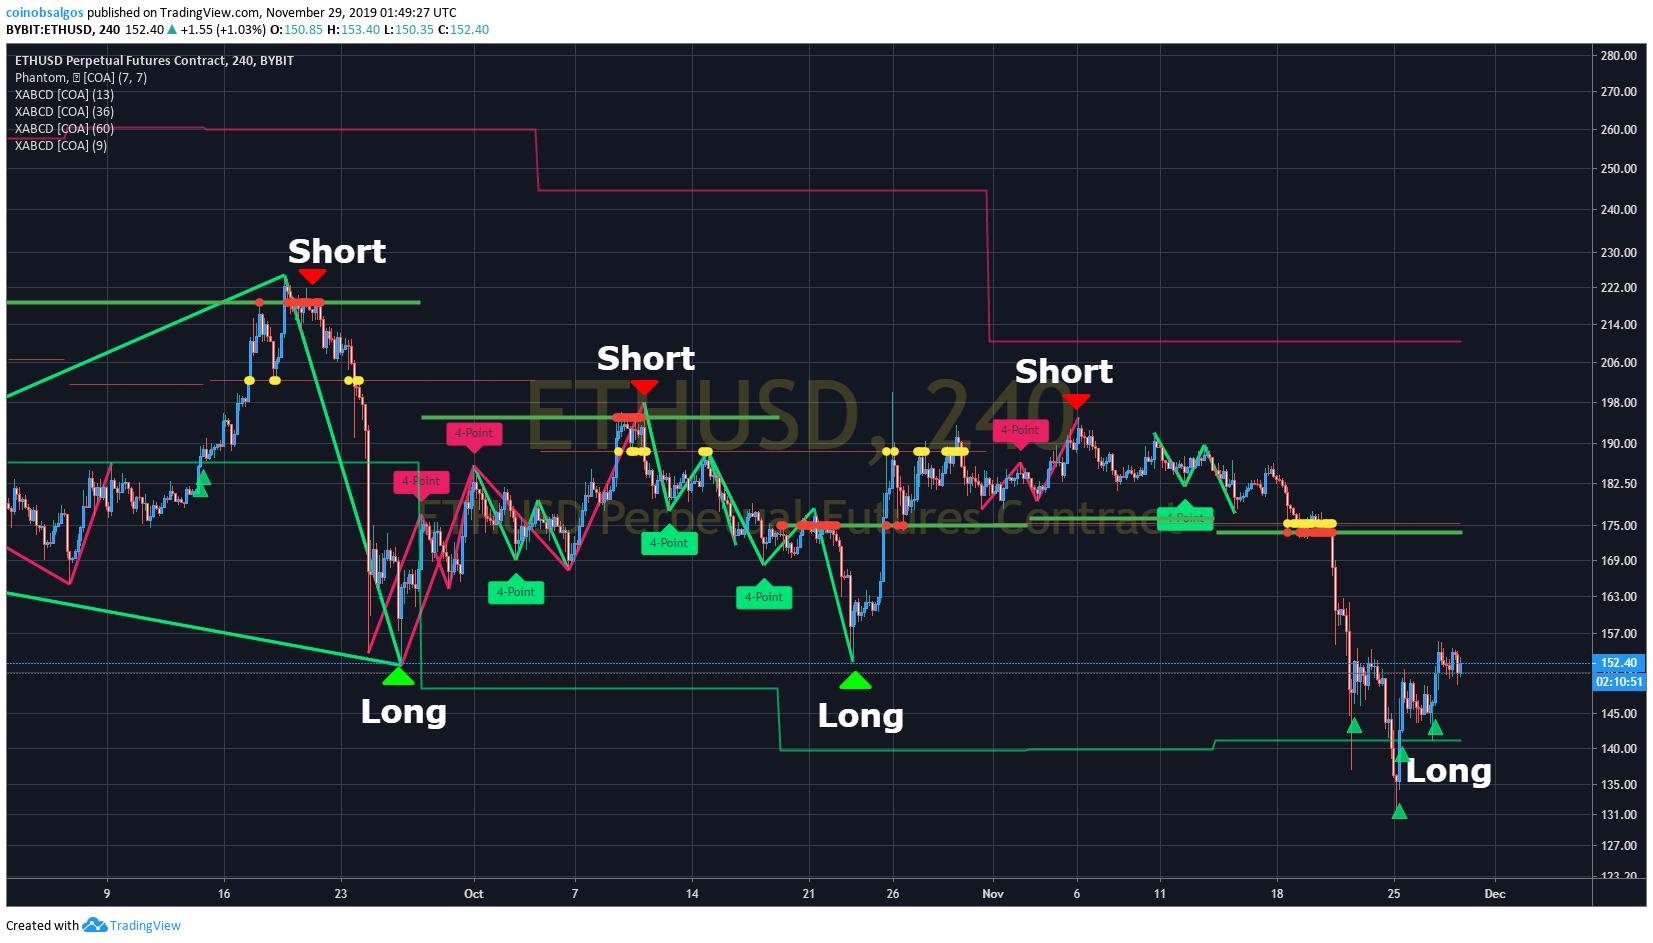
Our go-to top and bottom finding script. This indicator puts the most experienced traders to shame. If a breakout is going to fail, Phantom will show you where to sell and short. Same goes for longing bottoms.

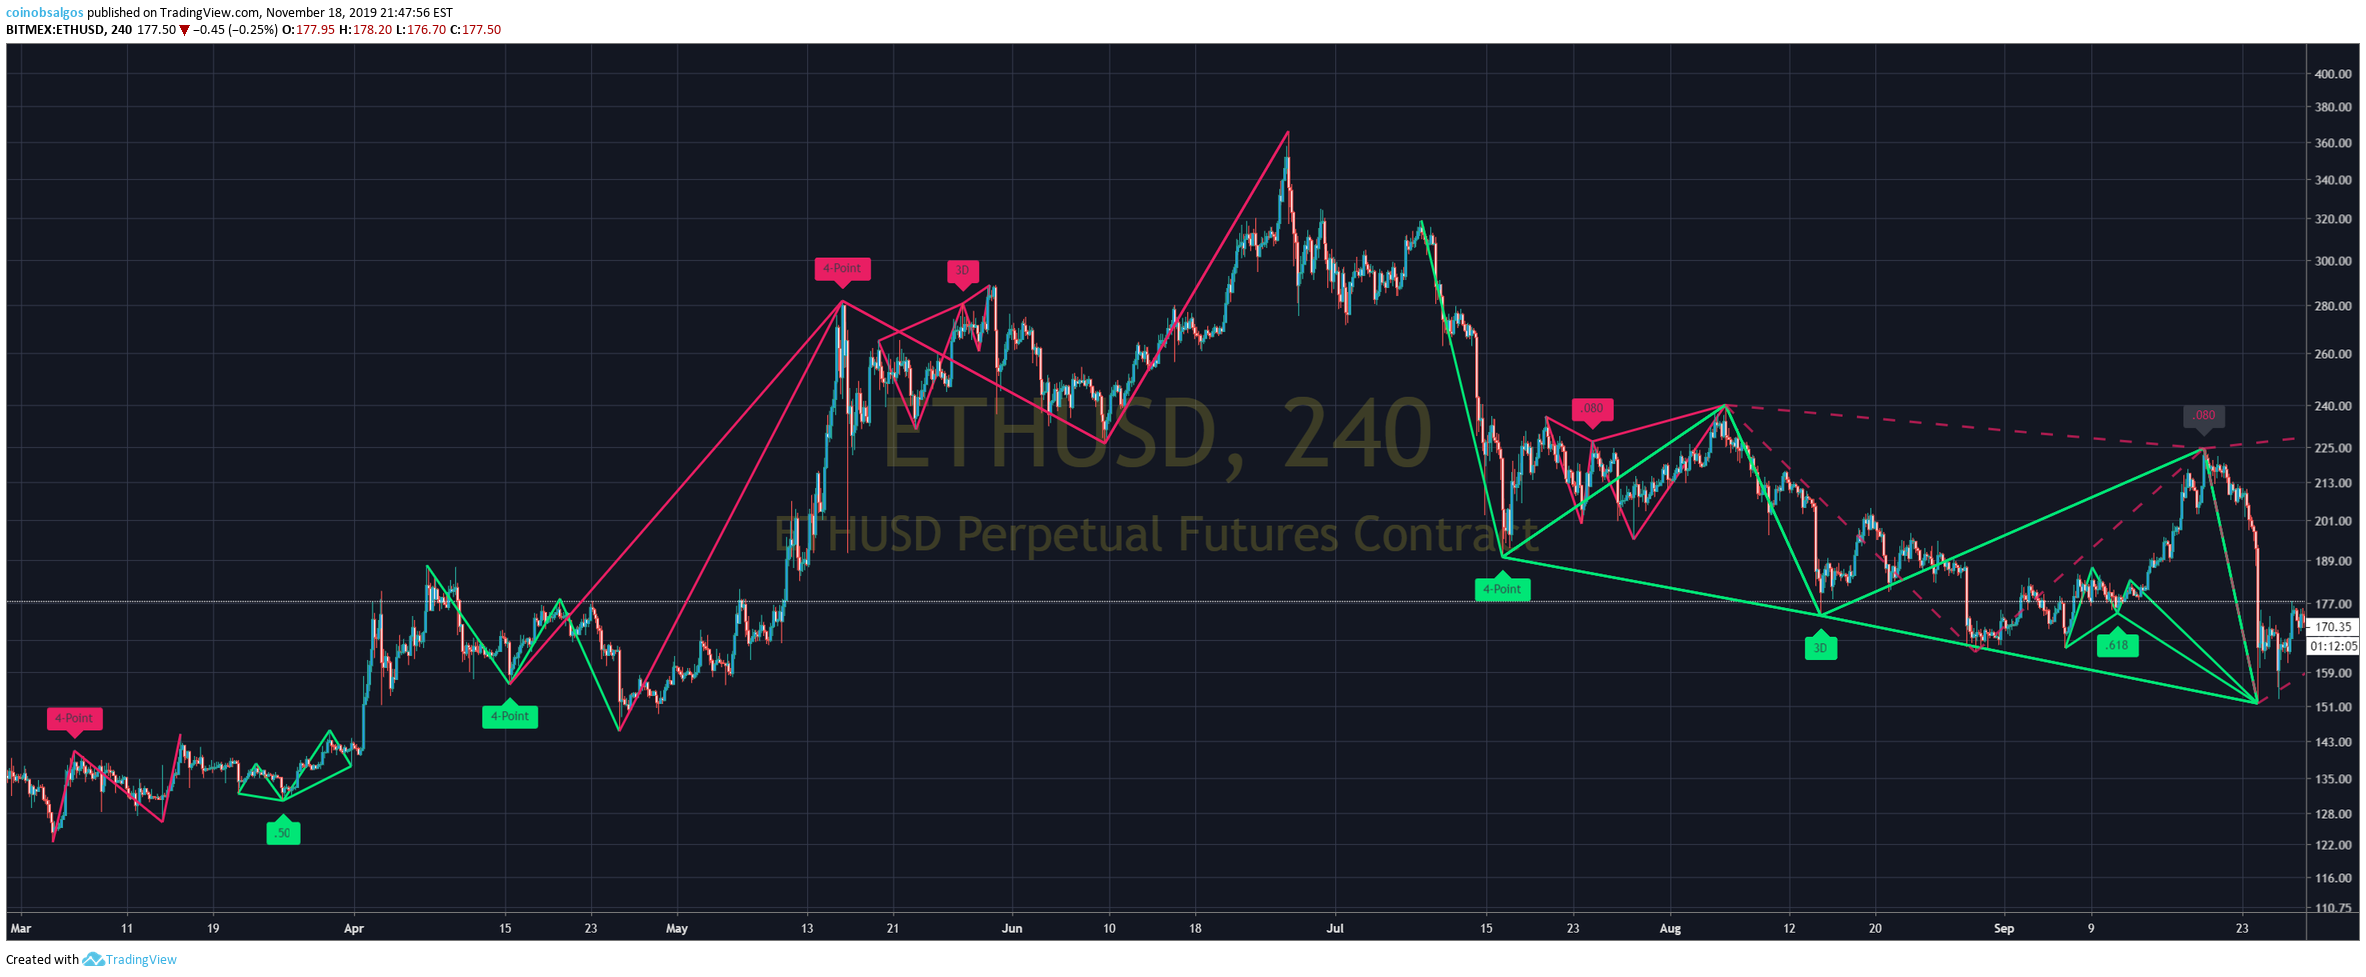
This Fibonacci pattern scanner that detects up to 10 formations! From the Butterfly, Wolfe, and Gartley, to the newer more complex patterns.
These patterns also enable you to Sell Tops, and Long Bottoms.
3. NEW: Relative Breadth Index
The most advanced Momentum Oscillator! Never FOMO again!
Spot divergences, and reversal confirmations with RBI.

Don't Miss Out
If you've read this far, you likely want to make better trades like the professionals. We want to help you!
If you don't, sure, you might save a little cash, but will you be making consistently profitable trades?
What about the other Technical Analysis tools to choose from?
RSI, MACD, EMAs, SMAs, Candle Stick Patterns, Chart Patterns...the list goes on.
With our Script Bundle, you get three of the BEST indicators out there, a proven system on how to trade them, AND a community of other traders just like you making wins using them.
Yes, you can learn how to beat the market. The key is to choose your edge, stick to it, and learn from others who use it successfully.
Recent Phantom Trades
Bitcoin, January 2020 Bottom

On January 2nd of 2020, Phantom's 2-hour chart signaled the bottom on $BTC Bitcoin.
This Phantom Signal was followed by a 36% Climb before running into Phantom's Sell zone.
Bitcoin Buy Price: $6,926
Bitcoin's Hedge Price: $9,478
Phantom users that Hedge using futures and options get the benefit of not trading one side, and maintaining exposure at Peaks. That way they secure their profits, and reduce exposure without having to find another entry signal.
SPY, CoronaVirus Crash? Or Phantom Liquidity
February 12th, through the 20th of 2020.
Phantom signaled a strong sell zone of the SPY, 8 days of selling before the "Coronavirus" Market Crash.
Phantom gives you foresight into what's around the corner. This time it was a 9% flash melting crash.
Phantom signaled a strong sell zone of the SPY, 8 days of selling before the "Coronavirus" Market Crash.
Phantom gives you foresight into what's around the corner. This time it was a 9% flash melting crash.

Bitcoin's Dump February 2020.

What to trade those big moves? Do you want to short those impossible to find tops ?
Phantom signaled the short on Bitcoin's top during the false breakout. Once again selling into "Breakout longers".
The end result? A 17% Dump within 7 days.
Phantom signaled the short on Bitcoin's top during the false breakout. Once again selling into "Breakout longers".
The end result? A 17% Dump within 7 days.
Phantom Positions Since the Drop?
Recent XABCD Scanner Trades:
$LTCBTC January 2020

January 2020, a 4-point harmonic pattern marked the bottom of the Litecoin/Bitcoin pair.
The signal resulted in a %46 gain.
And just 1 month later the scanner signaled another reversal, for a -17% Drop in LTCBTC pair.
Harmonics and Forex
The $GBPUSD chart on the right has traded very well according to harmonic patterns.
3- of which since resulted in major swings, in the short 29 days of February 2020.
And 1 formation produced a minor target.
Currently GPBUSD is at target 1, which was reached just 4 hours after reversed at the suggested prz.
3- of which since resulted in major swings, in the short 29 days of February 2020.
And 1 formation produced a minor target.
Currently GPBUSD is at target 1, which was reached just 4 hours after reversed at the suggested prz.

Bitcoin February 2020

Want to trade those seemingly impossible to time reversals?
Our harmonic scanner signaled the last 2 major pivots on Bitcoin in February, including the false breakout. Imagine if you sold short into the fake breakout and benefited from the %15 dump that followed.
Our harmonic scanner signaled the last 2 major pivots on Bitcoin in February, including the false breakout. Imagine if you sold short into the fake breakout and benefited from the %15 dump that followed.
Bitcoin's April Moves So Far?
Long signal on April 1st, at $6156 The absolute Daily Wick Low.
Resulting in an 18% Bullish Move
Resulting in an 18% Bullish Move
One Day Later, The hourly Chart signaled short on April 2nd,
Resulting in a -9.7$ Bear Move Down
Resulting in a -9.7$ Bear Move Down

CUSTOM JAVASCRIPT / HTML
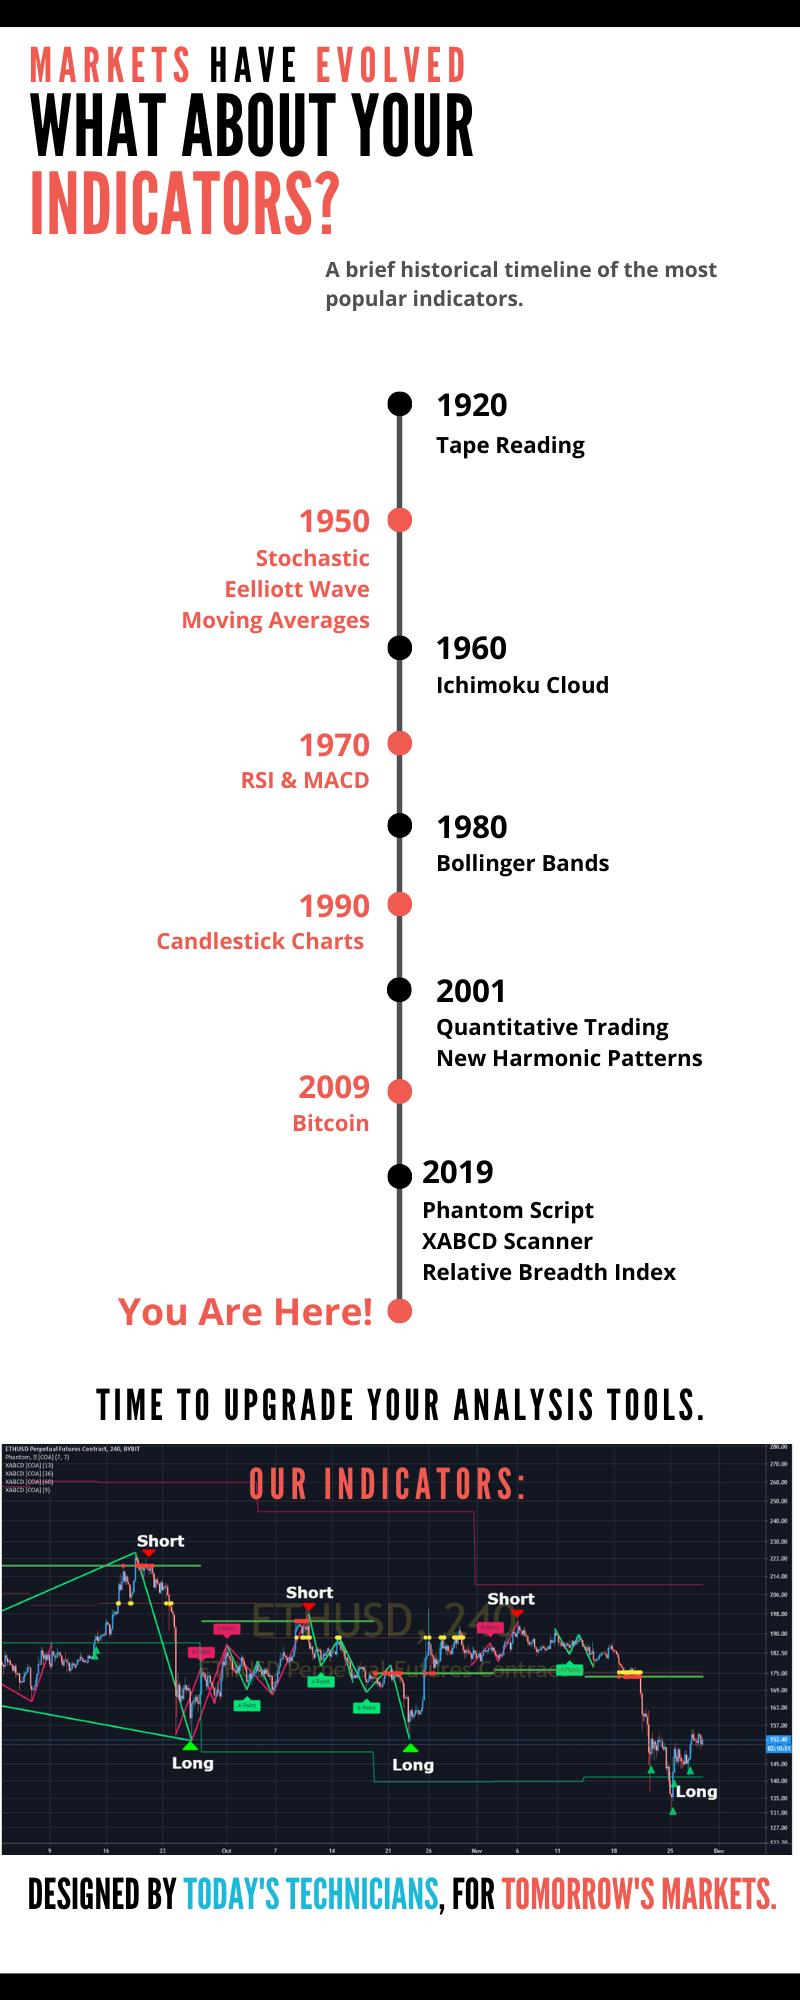
How old are your indicators? Older than you?
Our indicators are built to outperform the market and find reversal zones. Uniquely designed for TradingView.
Our Trading Suite makes buying low, selling high, profit taking, and hedging easy. Long, Short, Hedge all assets with this powerful combo.
Who Built These Systems?
We're a team of professional traders and software engineers. Together we build simple, clean, and beautiful TradingView scripts and indicators to help traders just like you see the market the way we do.

George Saber 27x'd his account in 2017 trading Altcoins using his unique ability to spot patterns in the market and profit from them.

André Crabb earned his Bachelor's Degree in Computer Science at UC Berkeley. His resume boasts companies like Amazon, Apple, and Pandora, among others, where he was responsible for delivering user-facing apps. Creating beautiful, simple to use applications and tools is his specialty. You'll get it when you see how sexy our indicators are!
© Copyright 2019 - All Rights Reserved, Coin Observatory Algos