
Community Access Included With Your 7-Day Trial →
Coin Observatory Algos
Indicators Built By Today's For Tomorrow's Markets
Unmatched Insight Into Market Reversals And Liquidity Zones
Phantom Script
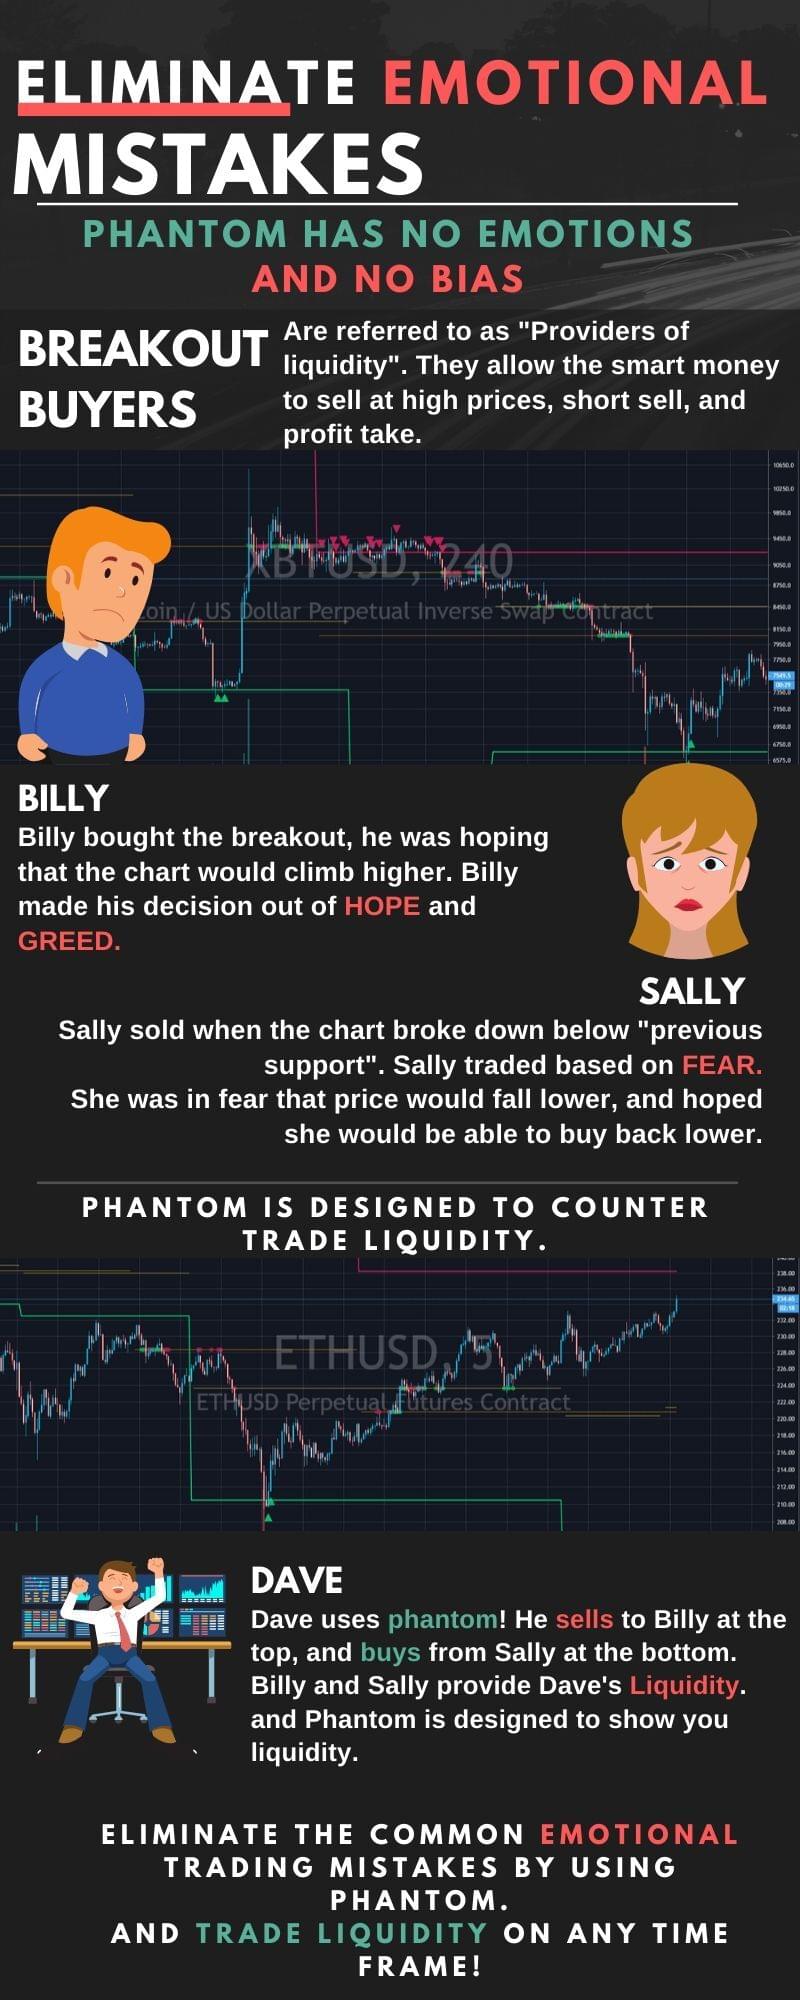
Proprietary liquidity indicator built for hedge funds, to counter trade the trickiest breakouts.

XABCD Scanner
The only full Harmonic Pattern Scanner for Tradingview.

RBI
Our In-House relative breadth index and the last oscillator you'll ever need.

The most powerful indicator combination on TradingView.
Use them across all markets and all time frames!
See What Others Have To Say,In Their Own Words


Introducing Phantom Script:
How Can Phantom Help You?
Bitcoin October 23-25, 2019

Large time-frames are really good for "negating chart noise".
Once price action exits phantom script it is in a no trade zone.
Upon re-entry is the golden opportunity.
Throughout October of 2019, Bitcoin's 4-hour Phantom was trading outside of the range. Which means the market was getting ready for Phantom re-entry.
Upon re-entry Bitcoin's price rejected at Phantom's Mid-line, which presented the first opportunity to sell short.
The Target and flip long were also predetermined.
Not only did phantom traders make a 10% Short after 6 weeks of market indecision.
But they were able to capture a Massive 43% long when phantom signaled long.
Intra-Day

Grand Opportunities?
Using Phantom during the SPY December 2018 Flash Crash
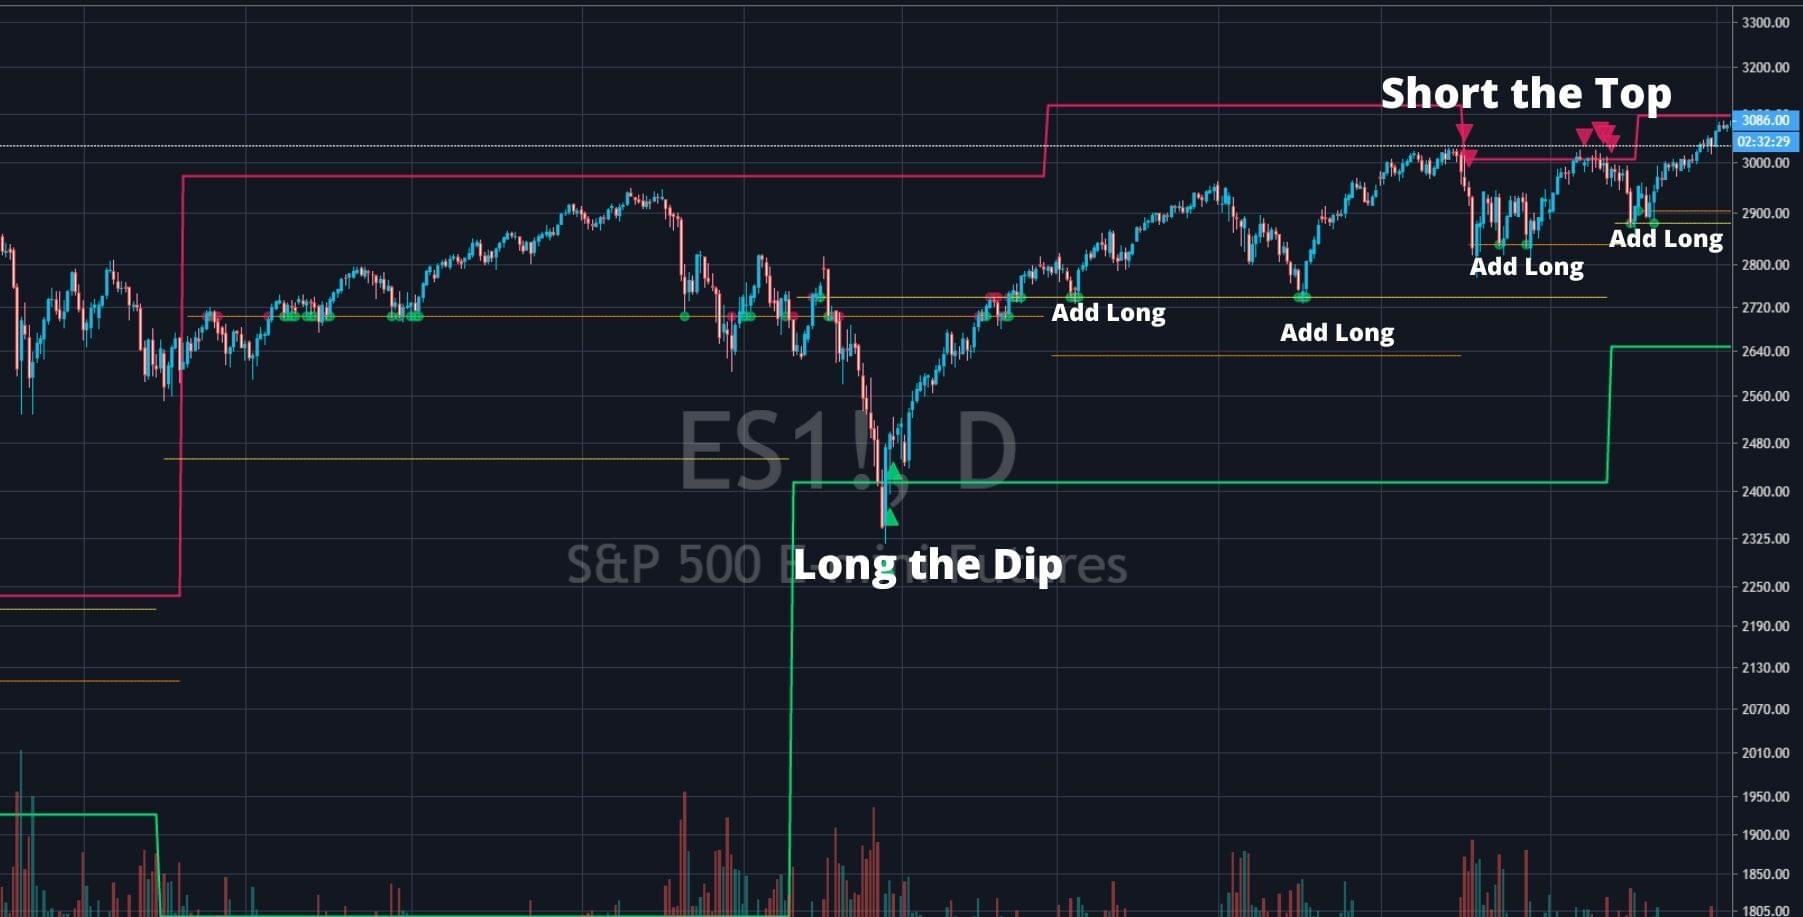
During late 2018 and 2019 Phantom signaled the BOTTOM on the $SPY
Then signaled to hedge or Sell the top, Phantom midlines are excellent for when the market appears to be in "indecision".
When price is closing above the midlines, a green dot signals, long.
When price closes below the midlines, a red dot signals short, or hedge.
During 2018 and 2019, Phantom not only signaled the bottom, but accumulated SPY for the breakout!
Recent Phantom Trades
Bitcoin, January 2020 Bottom

On January 2nd of 2020, Phantom's 2-hour chart signaled the bottom on $BTC Bitcoin.
This Phantom Signal was followed by a 36% Climb before running into Phantom's Sell zone.
Bitcoin Buy Price: $6,926
Bitcoin's Hedge Price: $9,478
Phantom users that Hedge using futures and options get the benefit of not trading one side, and maintaining exposure at Peaks. That way they secure their profits, and reduce exposure without having to find another entry signal.
SPY, CoronaVirus Crash? Or Phantom Liquidity
February 12th, through the 20th of 2020.
Phantom signaled a strong sell zone of the SPY, 8 days of selling before the "Coronavirus" Market Crash.
Phantom gives you foresight into what's around the corner. This time it was a 9% flash melting crash.
Phantom signaled a strong sell zone of the SPY, 8 days of selling before the "Coronavirus" Market Crash.
Phantom gives you foresight into what's around the corner. This time it was a 9% flash melting crash.

Bitcoin's Dump February 2020.

What to trade those big moves? Do you want to short those impossible to find tops ?
Phantom signaled the short on Bitcoin's top during the false breakout. Once again selling into "Breakout longers".
The end result? A 17% Dump within 7 days.
Phantom signaled the short on Bitcoin's top during the false breakout. Once again selling into "Breakout longers".
The end result? A 17% Dump within 7 days.
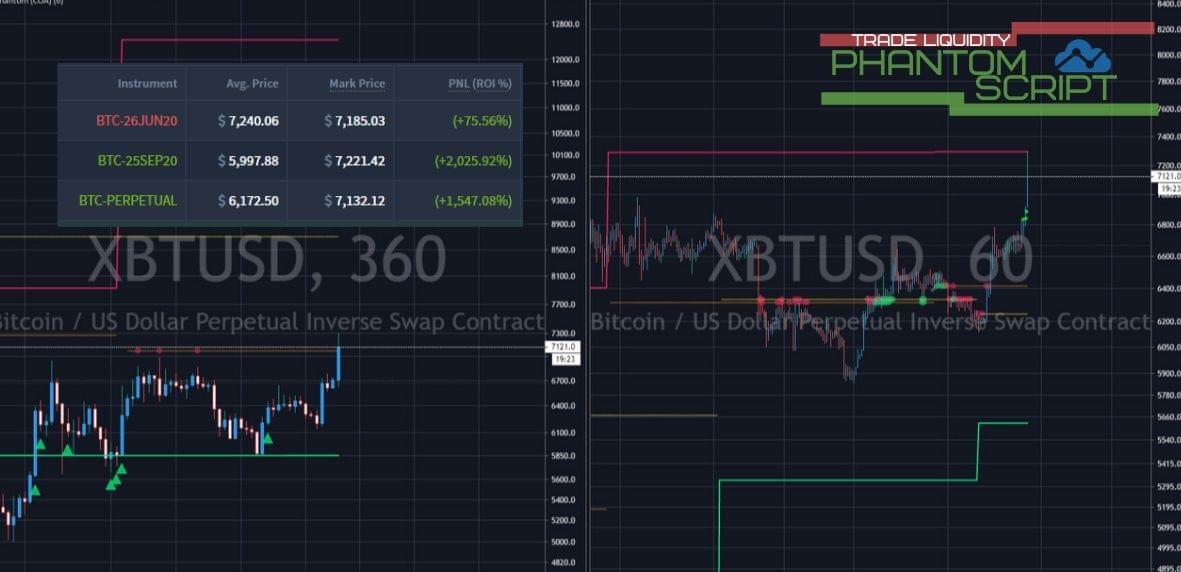
Phantom Positions Since the Drop?
XABCD Scanner
The Only, Comprehensive Harmonic Pattern Scanner for TradingView.
How It Works:
Gain Edge Into Trading Reversals
All Time Frames, All Asset Classes

Step 1: Wait for the pattern to complete.
Step 2: Scale in long or short.
Step 3: Use the suggested Stop Loss.
Step 4: Let the market do the work.
Step 5: Take profit at Targets.
Trade High Volatility:
February 2020, CoronaVirus Crash!
Trade High Volatility, all assets, all time frames!

Intra-Day Chop:

Choppy Markets? No Problem!
By Recognising over 10 harmonic patterns, our harmonic scanner will show you where to buy low, and sell high.
Even on the most unpredictable assets such as Bitcoin, as seen on the left.
By Recognising over 10 harmonic patterns, our harmonic scanner will show you where to buy low, and sell high.
Even on the most unpredictable assets such as Bitcoin, as seen on the left.
Intra-Day Chop:
Recent XABCD Trades
$LTCBTC, January 2020 Bottom

January 2020, a 4-point harmonic pattern marked the bottom of the Litecoin/Bitcoin pair.
The signal resulted in a %46 gain.
And just 1 month later the scanner signaled another reversal, for a -17% Drop in LTCBTC pair.
The signal resulted in a %46 gain.
And just 1 month later the scanner signaled another reversal, for a -17% Drop in LTCBTC pair.
What About Harmonics and Forex?
The $GBPUSD chart on the right has traded very well according to harmonic patterns.
3- of which since resulted in major swings, in the short 29 days of February 2020.
And 1 formation produced a minor target.
Currently GPBUSD is at target 1, which was reached just 4 hours after reversed at the suggested prz.
3- of which since resulted in major swings, in the short 29 days of February 2020.
And 1 formation produced a minor target.
Currently GPBUSD is at target 1, which was reached just 4 hours after reversed at the suggested prz.

Bitcoin's February 2020.

Want to trade those seemingly impossible to time reversals?
Our harmonic scanner signaled the last 2 major pivots on Bitcoin in February, including the false breakout. Imagine if you sold short into the fake breakout and benefited from the %15 dump that followed.
Our harmonic scanner signaled the last 2 major pivots on Bitcoin in February, including the false breakout. Imagine if you sold short into the fake breakout and benefited from the %15 dump that followed.
Bitcoin's April Moves So Far?
Long signal on April 1st,
Resulting in an 18% Bull Move
Resulting in an 18% Bull Move
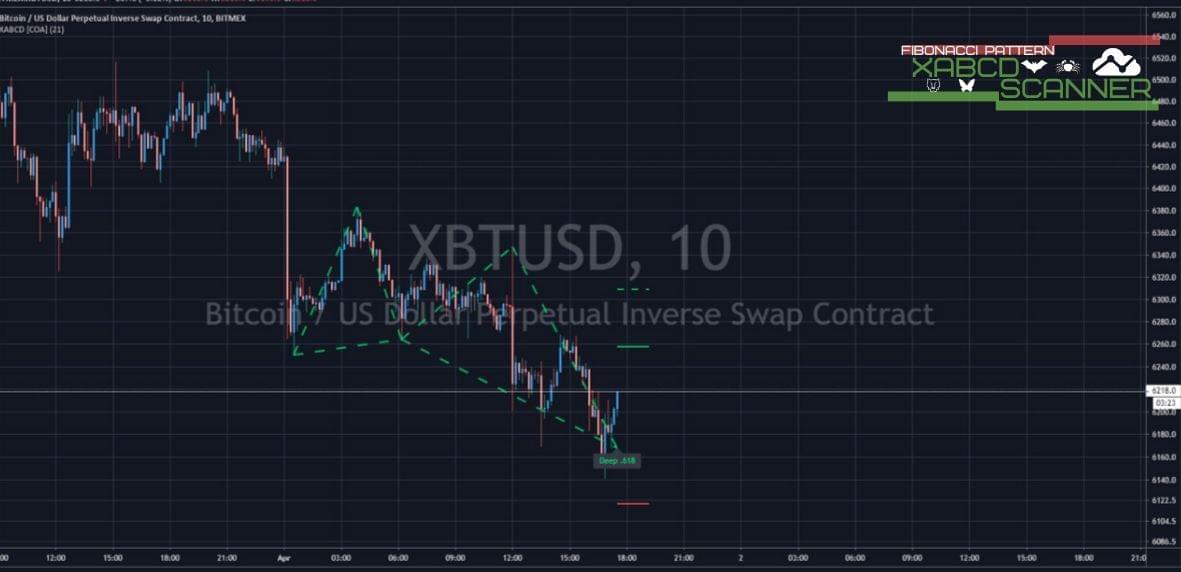
Short signal on April 2nd,
Resulting in a -9.7$ Bear Move Down
Resulting in a -9.7$ Bear Move Down

Ready to stop blaming the market and start seeing it with a new set of eyes?


Meet RBI,
The Relative Breadth Index
The Only Oscillator You'll Ever Need
Most momentum oscillators are becoming obsolete,
You know you can't rely on them anymore, so why even trade them?
RBI is comprehensive, leading, easy to read, delivers divergences, signals, and true relative breadth.
You know you can't rely on them anymore, so why even trade them?
RBI is comprehensive, leading, easy to read, delivers divergences, signals, and true relative breadth.
Leading Trend ID
RBI allows you to identify the true nature of the trend and will signal reversals earlier than any other oscillator.
Divergences
Detect powerful divergences and hidden divergences and capitalise on the incoming reversal. RBI is asset relative, and is fine tuned to detect reliable divergences.
Clear Signals
Easy to read, loaded with signals for both current trend, and interim move.
RBI delivers both divergence indications to buy and sell signals.
RBI delivers both divergence indications to buy and sell signals.
Truth #1 about Markets:
The few take the majority's moneys.
The few take the majority's moneys.
Trend And Breadth
Positive Vs Negative

One of the simplest uses of RBI is detecting trend shifts.
Trend Shifts are represented by K and D crossovers, these crossovers are visible on all time frames.
K is represented by the green oscillator and D by the Red. Similar to a Stochastic oscillator, but in RBI K/D will capture the majority of the trend.
K is represented by the green oscillator and D by the Red. Similar to a Stochastic oscillator, but in RBI K/D will capture the majority of the trend.
K/D crossovers represent trend Shifts, when K above D the trend is bullish, and the inverse is bearish.
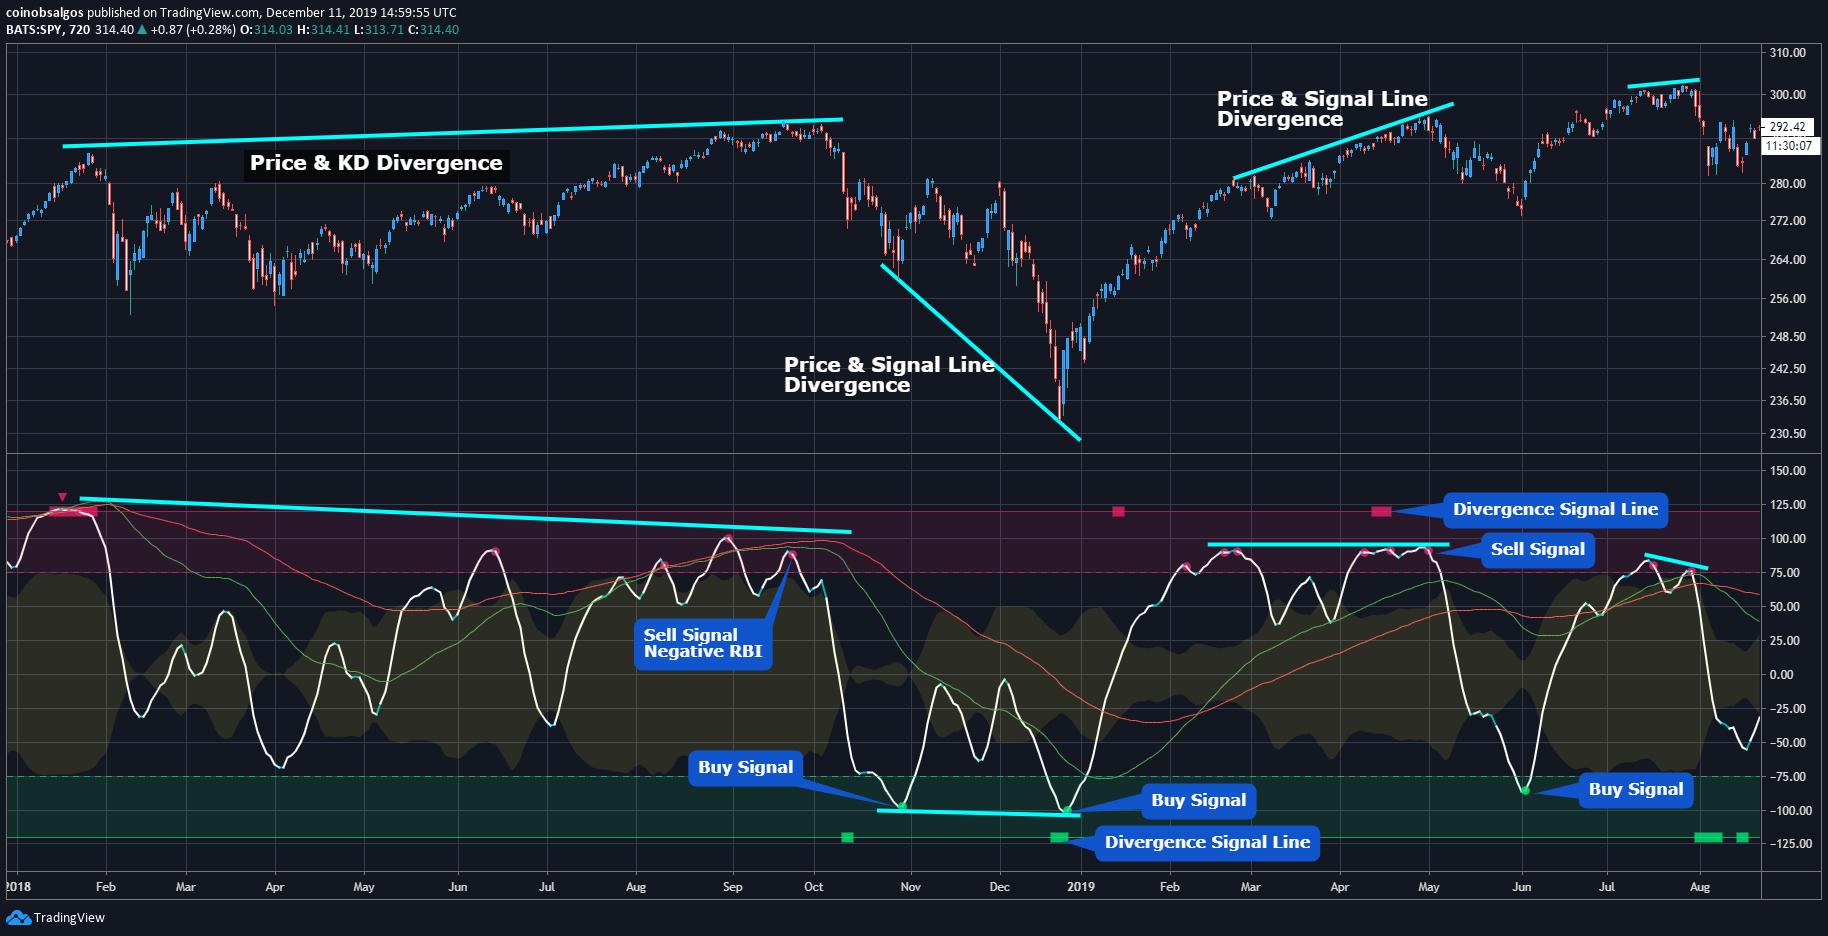
RBI's unique 3 line nature provides traders with the most reliable signals, and the built in signal confirmation features make it fool proof!
The Previously mentioned KD lines are accompanied by a Signal Line, in white.
KD represent relative breadth. And once breadth becomes divergent from price, while breadth is negative; not only is RBI signalling a true top is ahead. The signal line will also gift the trader the most opportune moment to short sell at a market top, far ahead of the correction.
KD represent relative breadth. And once breadth becomes divergent from price, while breadth is negative; not only is RBI signalling a true top is ahead. The signal line will also gift the trader the most opportune moment to short sell at a market top, far ahead of the correction.
Never FOMO Again!
CUSTOM JAVASCRIPT / HTML
Ready To Start Momentum Like Never Before?
Introducing The Signal Line!
Introducing The Signal Line!
Buy and Sell Signals

Easily pick local tops and bottoms with the Signal line!
Rectangles in overbought and oversold extremes hint "look for a possible divergence."
Circles along the Signal line, Green is a buy signal, Red is a Sell Signal.
Triangles along the Signal line, Green is a Strong Buy Signal, and Red is a strong Sell Signal.
Cyan along the Signal line, means Trend Shift and likely a change in real-time trend direction is coming.
Circles along the Signal line, Green is a buy signal, Red is a Sell Signal.
Triangles along the Signal line, Green is a Strong Buy Signal, and Red is a strong Sell Signal.
Cyan along the Signal line, means Trend Shift and likely a change in real-time trend direction is coming.
Signal Line Trend Shifts
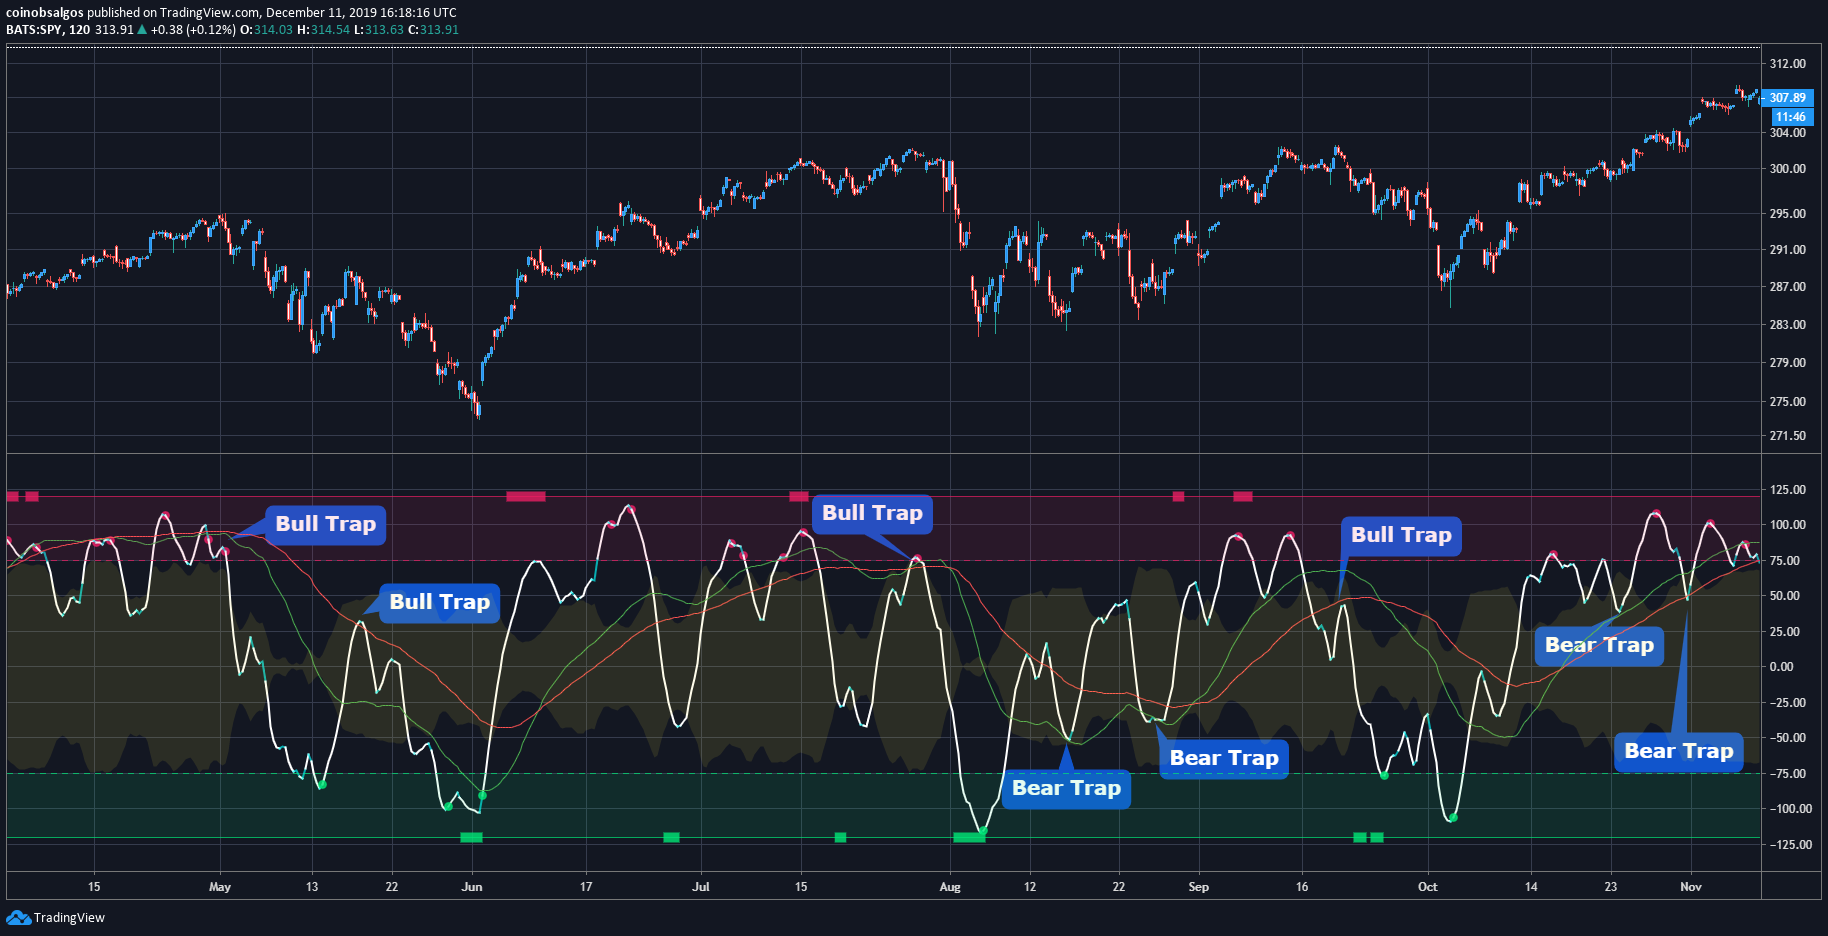
Large Time Frames and Grand Opportunities!

Want Even More Edge?
Ready To Trade The Traps!
Bull Traps, Bear Traps, and the Most Violent Swings?
Signal Line and KD Support/Resistance!


Who Are These Guys?
We're a team of professional traders and software engineers. Together we build simple, clean, and beautiful TradingView scripts and indicators to help traders just like you see the market the way we do.

George Saber 27x'd his account in 2017 trading Altcoins using his unique ability to spot patterns in the market and profit from them.

André Crabb earned his Bachelor's Degree in Computer Science at UC Berkeley. His expertise comes from working at companies like Amazon, Apple, and Pandora, among others, where he was responsible for delivering user-facing apps. Creating beautiful, simple to use applications and tools is his specialty.
Still Have Questions?
© Copyright 2019 - All Rights Reserved, Coin Observatory Algos