
Meet RBI,
The Relative Breadth Index
The Only Oscillator You'll Ever Need
Most momentum oscillators are becoming obsolete,
You know you can't rely on them anymore, so why even trade them?
RBI is comprehensive, leading, easy to read, delivers divergences, signals, and true relative breadth.
You know you can't rely on them anymore, so why even trade them?
RBI is comprehensive, leading, easy to read, delivers divergences, signals, and true relative breadth.
Leading Trend ID
RBI allows you to identify the true nature of the trend and will signal reversals earlier than any other oscillator.
Divergences
Detect powerful divergences and hidden divergences and capitalise on the incoming reversal. RBI is asset relative, and is fine tuned to detect reliable divergences.
Clear Signals
Easy to read, loaded with signals for both current trend, and interim move.
RBI delivers both divergence indications to buy and sell signals.
RBI delivers both divergence indications to buy and sell signals.
Truth #1 about Markets:
The few take the majority's moneys.
The few take the majority's moneys.
Trend And Breadth
Positive Vs Negative

One of the simplest uses of RBI is detecting trend shifts.
Trend Shifts are represented by K and D crossovers, these crossovers are visible on all time frames.
K is represented by the green oscillator and D by the Red. Similar to a Stochastic oscillator, but in RBI K/D will capture the majority of the trend.
K is represented by the green oscillator and D by the Red. Similar to a Stochastic oscillator, but in RBI K/D will capture the majority of the trend.
K/D crossovers represent trend Shifts, when K above D the trend is bullish, and the inverse is bearish.
RBI's unique 3 line nature provides traders with the most reliable signals, and the built in signal confirmation features make it fool proof!
The Previously mentioned KD lines are accompanied by a Signal Line, in white.
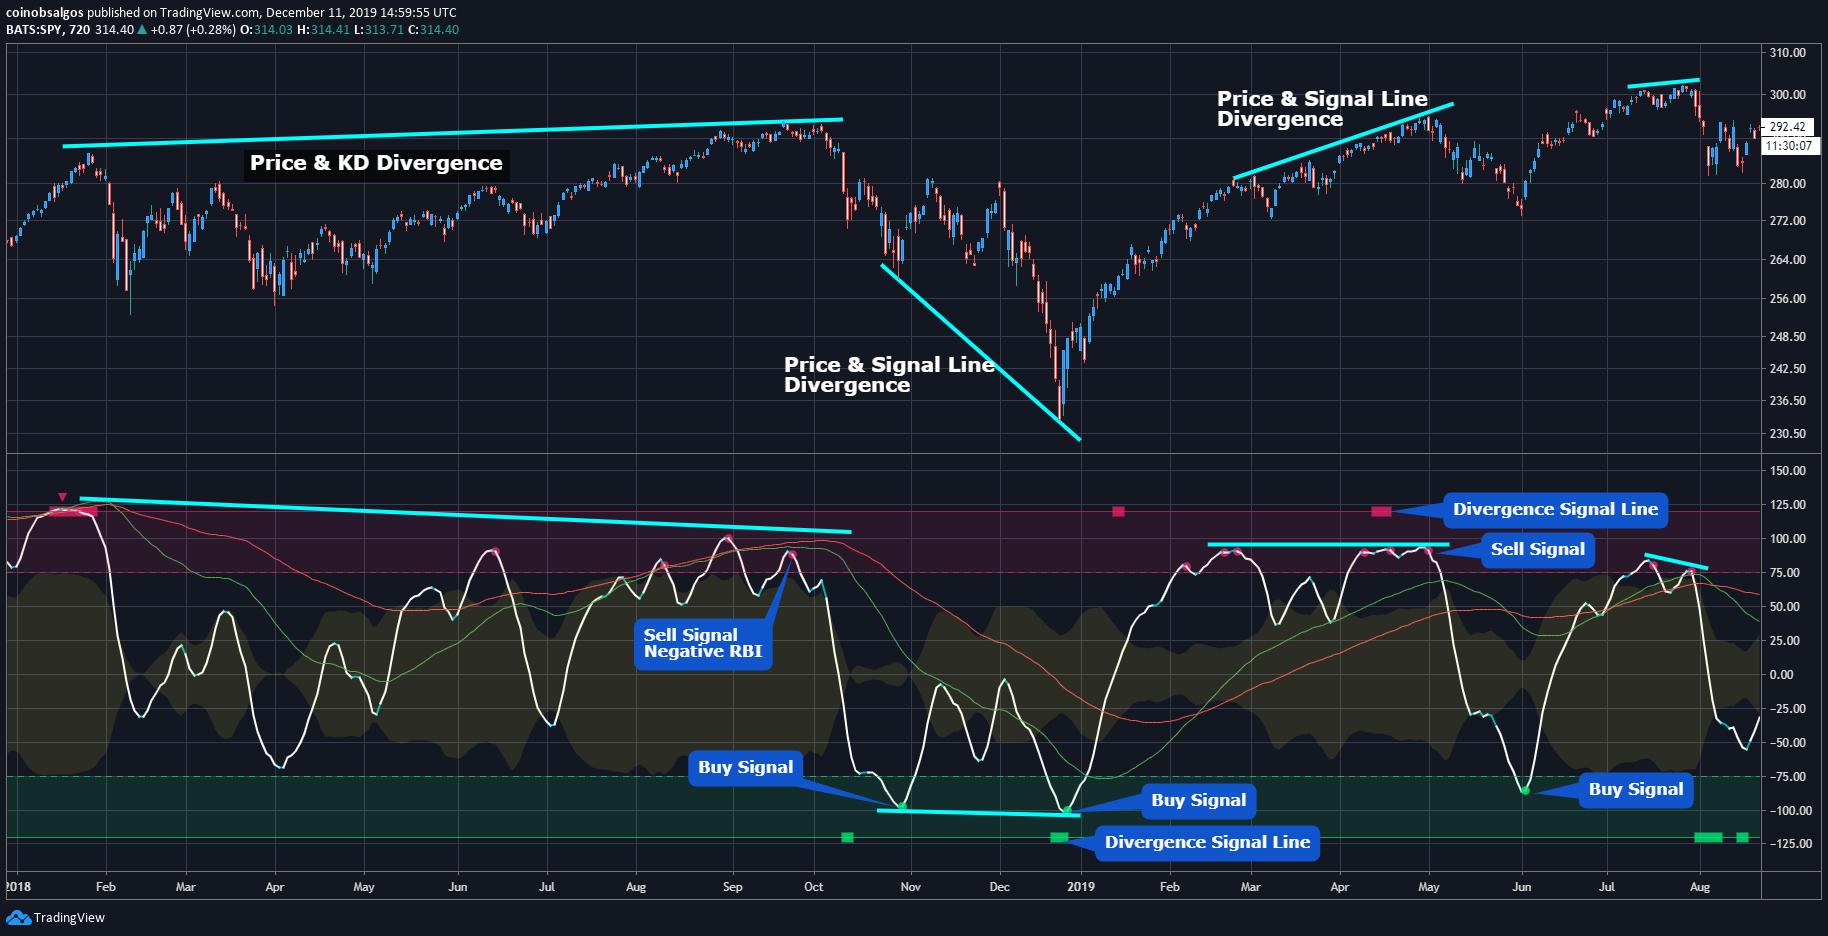
KD represent relative breadth. And once breadth becomes divergent from price, while breadth is negative; not only is RBI signalling a true top is ahead. The signal line will also gift the trader the most opportune moment to short sell at a market top, far ahead of the correction.
KD represent relative breadth. And once breadth becomes divergent from price, while breadth is negative; not only is RBI signalling a true top is ahead. The signal line will also gift the trader the most opportune moment to short sell at a market top, far ahead of the correction.
Never FOMO Again!
CUSTOM JAVASCRIPT / HTML
Ready To Start Momentum Like Never Before?
Introducing The Signal Line!
Introducing The Signal Line!
Buy and Sell Signals

Easily pick local tops and bottoms with the Signal line!
Rectangles in overbought and oversold extremes hint "look for a possible divergence."
Circles along the Signal line, Green is a buy signal, Red is a Sell Signal.
Triangles along the Signal line, Green is a Strong Buy Signal, and Red is a strong Sell Signal.
Cyan along the Signal line, means Trend Shift and likely a change in real-time trend direction is coming.
Circles along the Signal line, Green is a buy signal, Red is a Sell Signal.
Triangles along the Signal line, Green is a Strong Buy Signal, and Red is a strong Sell Signal.
Cyan along the Signal line, means Trend Shift and likely a change in real-time trend direction is coming.
Signal Line Trend Shifts
Large Time Frames and Grand Opportunities!

Want Even More Edge?
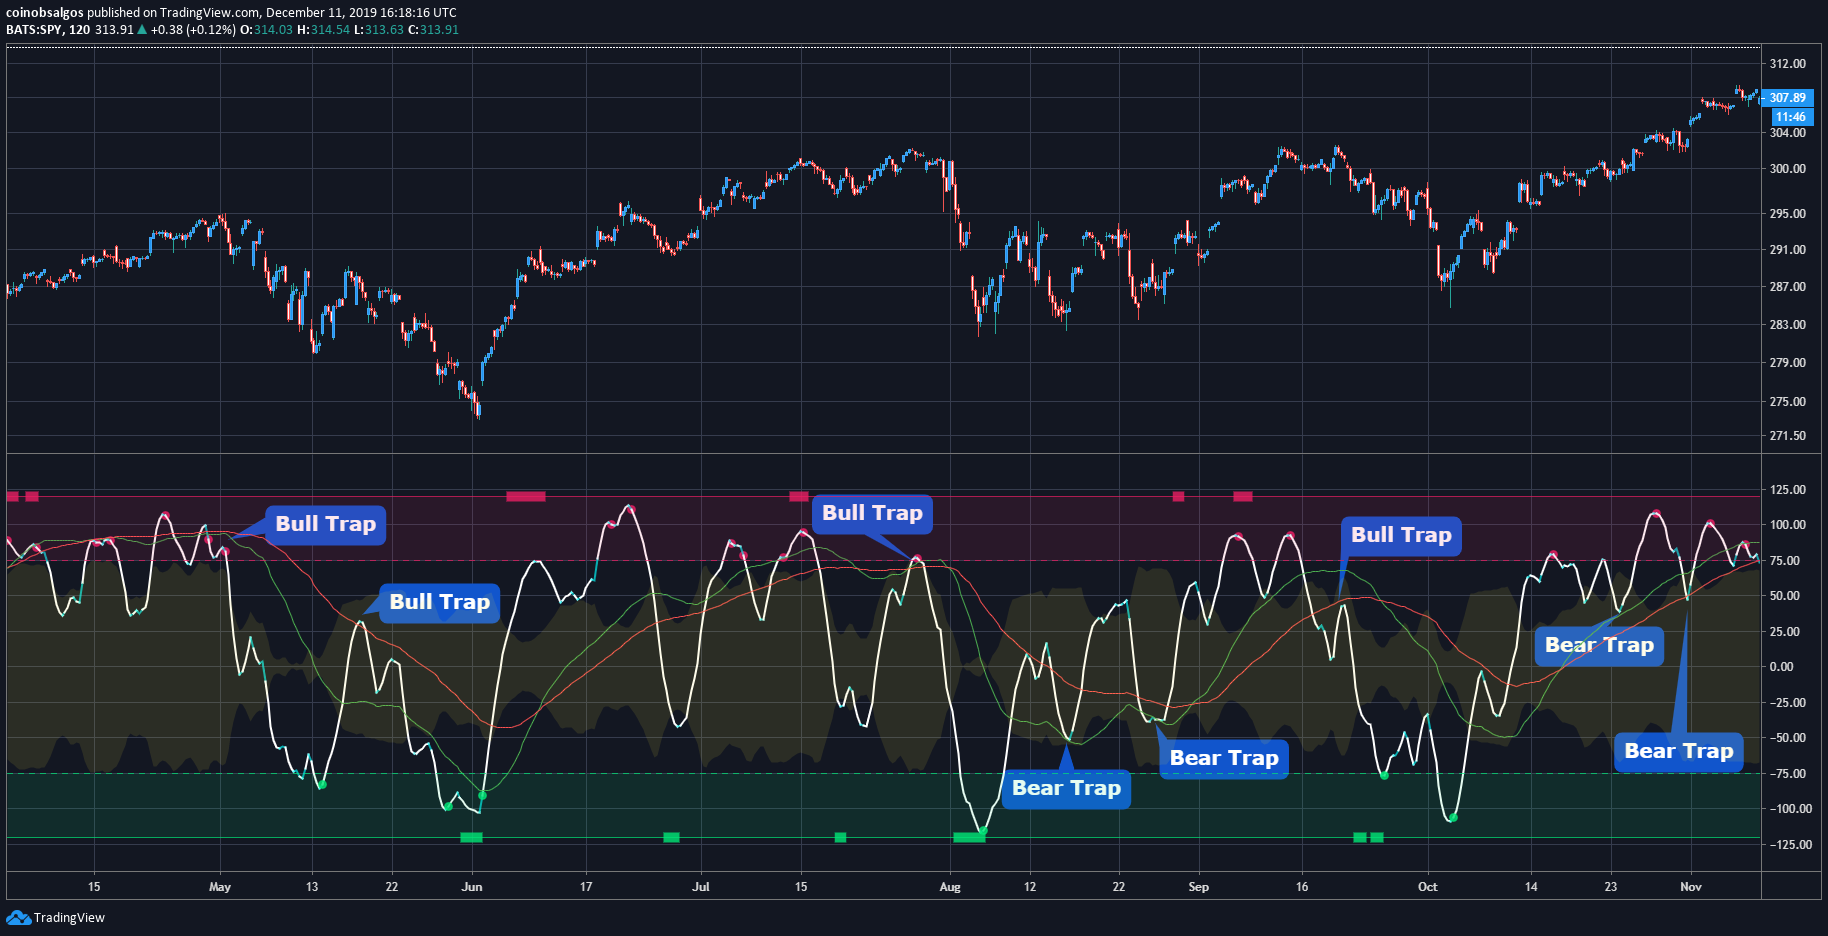
Ready To Trade The Traps!
Bull Traps, Bear Traps, and the Most Violent Swings?
Signal Line and KD Support/Resistance!
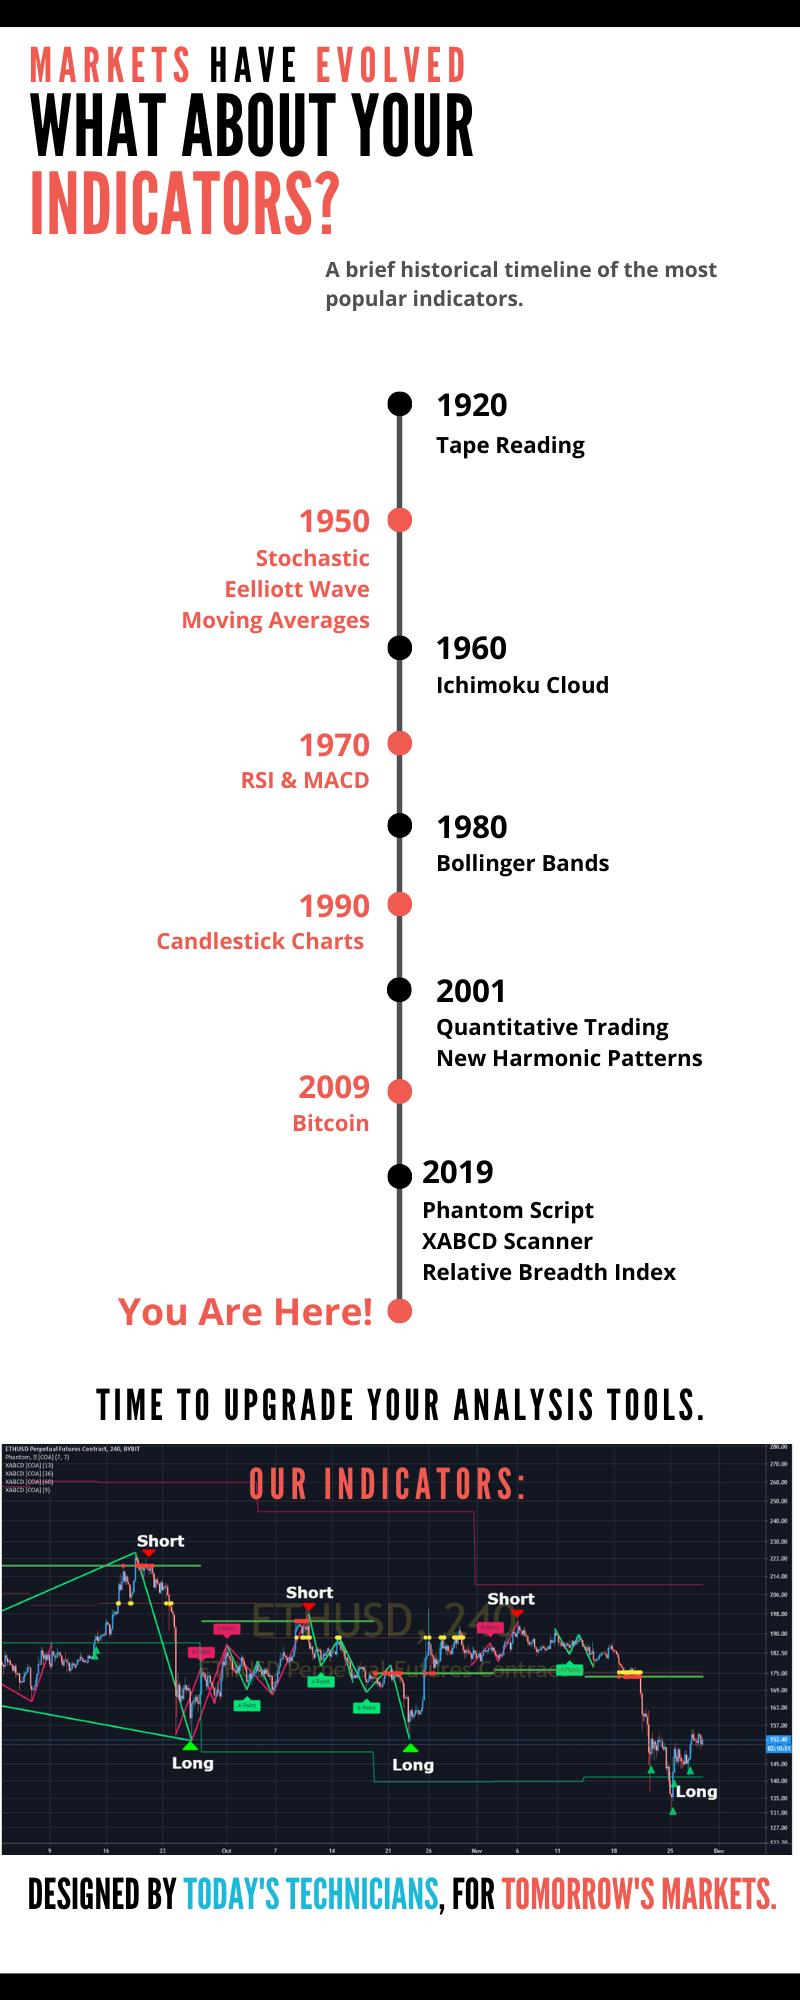
Truth #2 about Markets:
Most Indicators are older than traders themselves.
Most Indicators are older than traders themselves.
RBI was designed by Today's Technicians for Tomorrow's Markets!
According to the 2019 CMT "Chartered Market Technician" Handbook, oscillators are so old, they've been rendered obsolete, and are no longer usable.
How old are your indicators?
We get it! Navigating markets is hard.
That's why we designed the Relative Breadth Index. To give YOU the more edge and to make generating profits much easier.
Tell your lagging indicators to step aside. RBI shows what's happening now.

True Signals
RBI is forward-thinking. It's not about what has happened, but about what can happen next.
Exclusively on TradingView
RBI is built for the TradingView platform and can be used with all account types.

Simple
We pride ourselves in building simple, easy to read indicators.
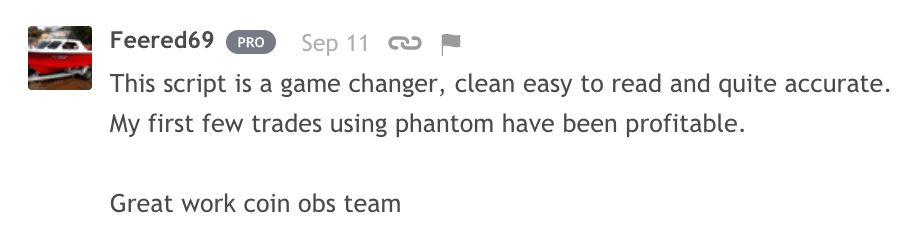
This is what our customers have said about our Indicators!
Don't take our word, see our testimonials


Want to see more?
Join our active trading community during your trial to ask questions and see how other traders just like you are making winning trades.
CUSTOM JAVASCRIPT / HTML
© Copyright 2019 - All Rights Reserved